“A small body of evidence suggests that when it comes to decision making, indoor air may matter more than we have realized.” was the opener of an NYT article I stumbled upon probably around the time it was written in, spring 2019.
After reading a bit more about the quite measurable effect of high CO2-levels on concentration - a negative correlation, unsurprisingly - I decided it would be cool to have one myself. CO2 readings are easy enough to interpret: Around 400ppm is the usual concentration outside (currently), and 1000ppm is usually where the first adverse symptoms are measured. This second threshold tastes a bit more like a convenient rule of thumb than a scientifically determined value, but good enough for me. What do we want, then? A small device, measuring the CO2 level somewhat accurately and displaying it. Consumer hardware at least relatively lauded by reviews and tests seems to come in at around $40 to $80 bucks. Definitely an agreeable price to solve the problem, albeit high enough that I immediately decided to spend ten times the effort and about the same amount of money on doing it myself.
I’ll give a short outline what I built and from which parts, but since I heavily relied on (readily available) materials by others in almost every step, I will keep it short. The build process is also very straightforward even with little technical knowledge, so I can definitely recommend this as an impactful personal side project to get started with this whole hardware DIY thing. Bringing this project to a point where it provided value for me personally took me over a year of sporadic insulated effort, but the reasons for that have very little to do with the technical complexity and will be discussed at the end.
Hardware Needed
- Minicomputer (I had a Raspberry Pi lying around, an Arduino will do)
- Power Supply
- Some female-female cables (or solder equipment)
- A CO2 sensor; I used the MH-Z19
- A small screen, I used the…* inhales *… 0.96″ I2C IIC SPI Serial 128X64 OLED LCD LED
Setup
Connect the two peripheral devices to your Pi according to the schematics you can find. If you use other than the ones I listed, I recommend to research beforehand whether there are installation guides that look understandable to you for the given module.
Software
Here is my final result (I know). It works, though! I won’t share my whole code here because it is both not cleaned up and full off experiments which were fun to do but have little replication value. Some guidance, however:
- Unless you have a reason not to, use software libraries for the used modules already written by other nice people in the language that is most common/easiest on your microcontroller. For Pis, this is probably going to be Python. In my example, there is the mh_z19 library to interact with the CO2 sensor as well as the extensive luma library to write to the tiny screen.
- First get comfortable with one library, then the other, only then marry them together. Do some simple experiments first, like printing the CO2 reading to your CLI or writting “Hello, Me” on the screen.
My setup does the following:
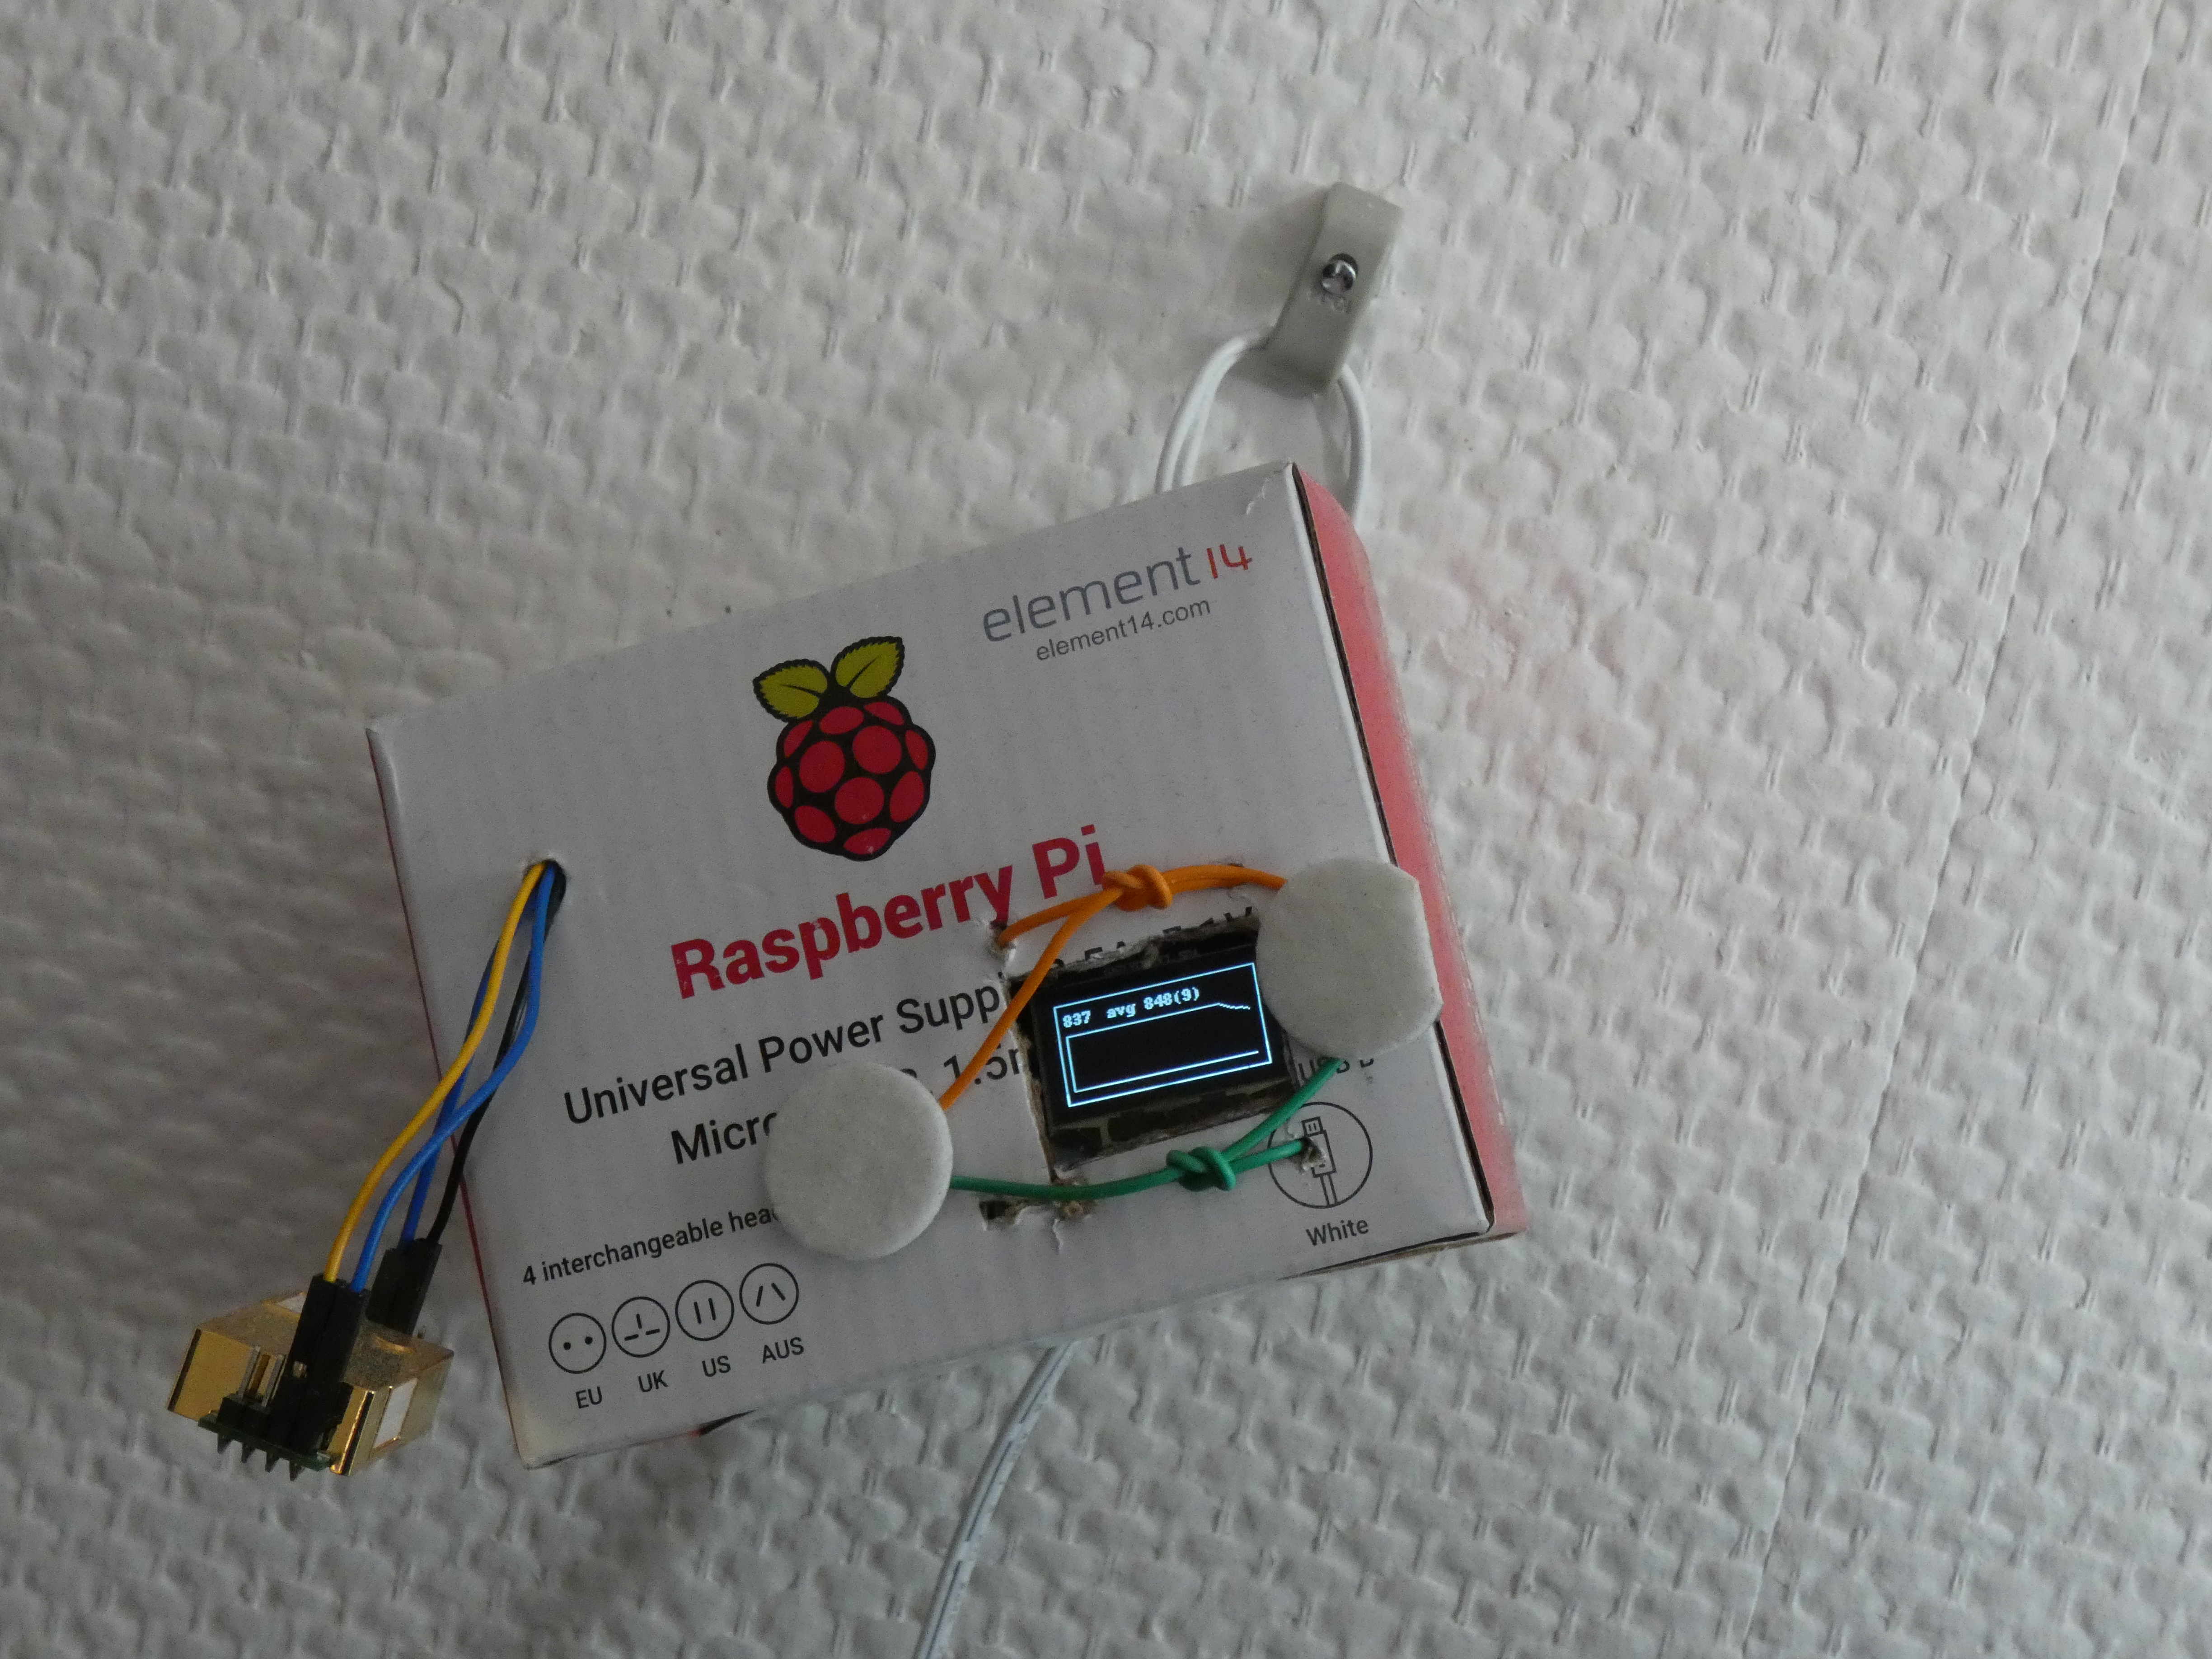
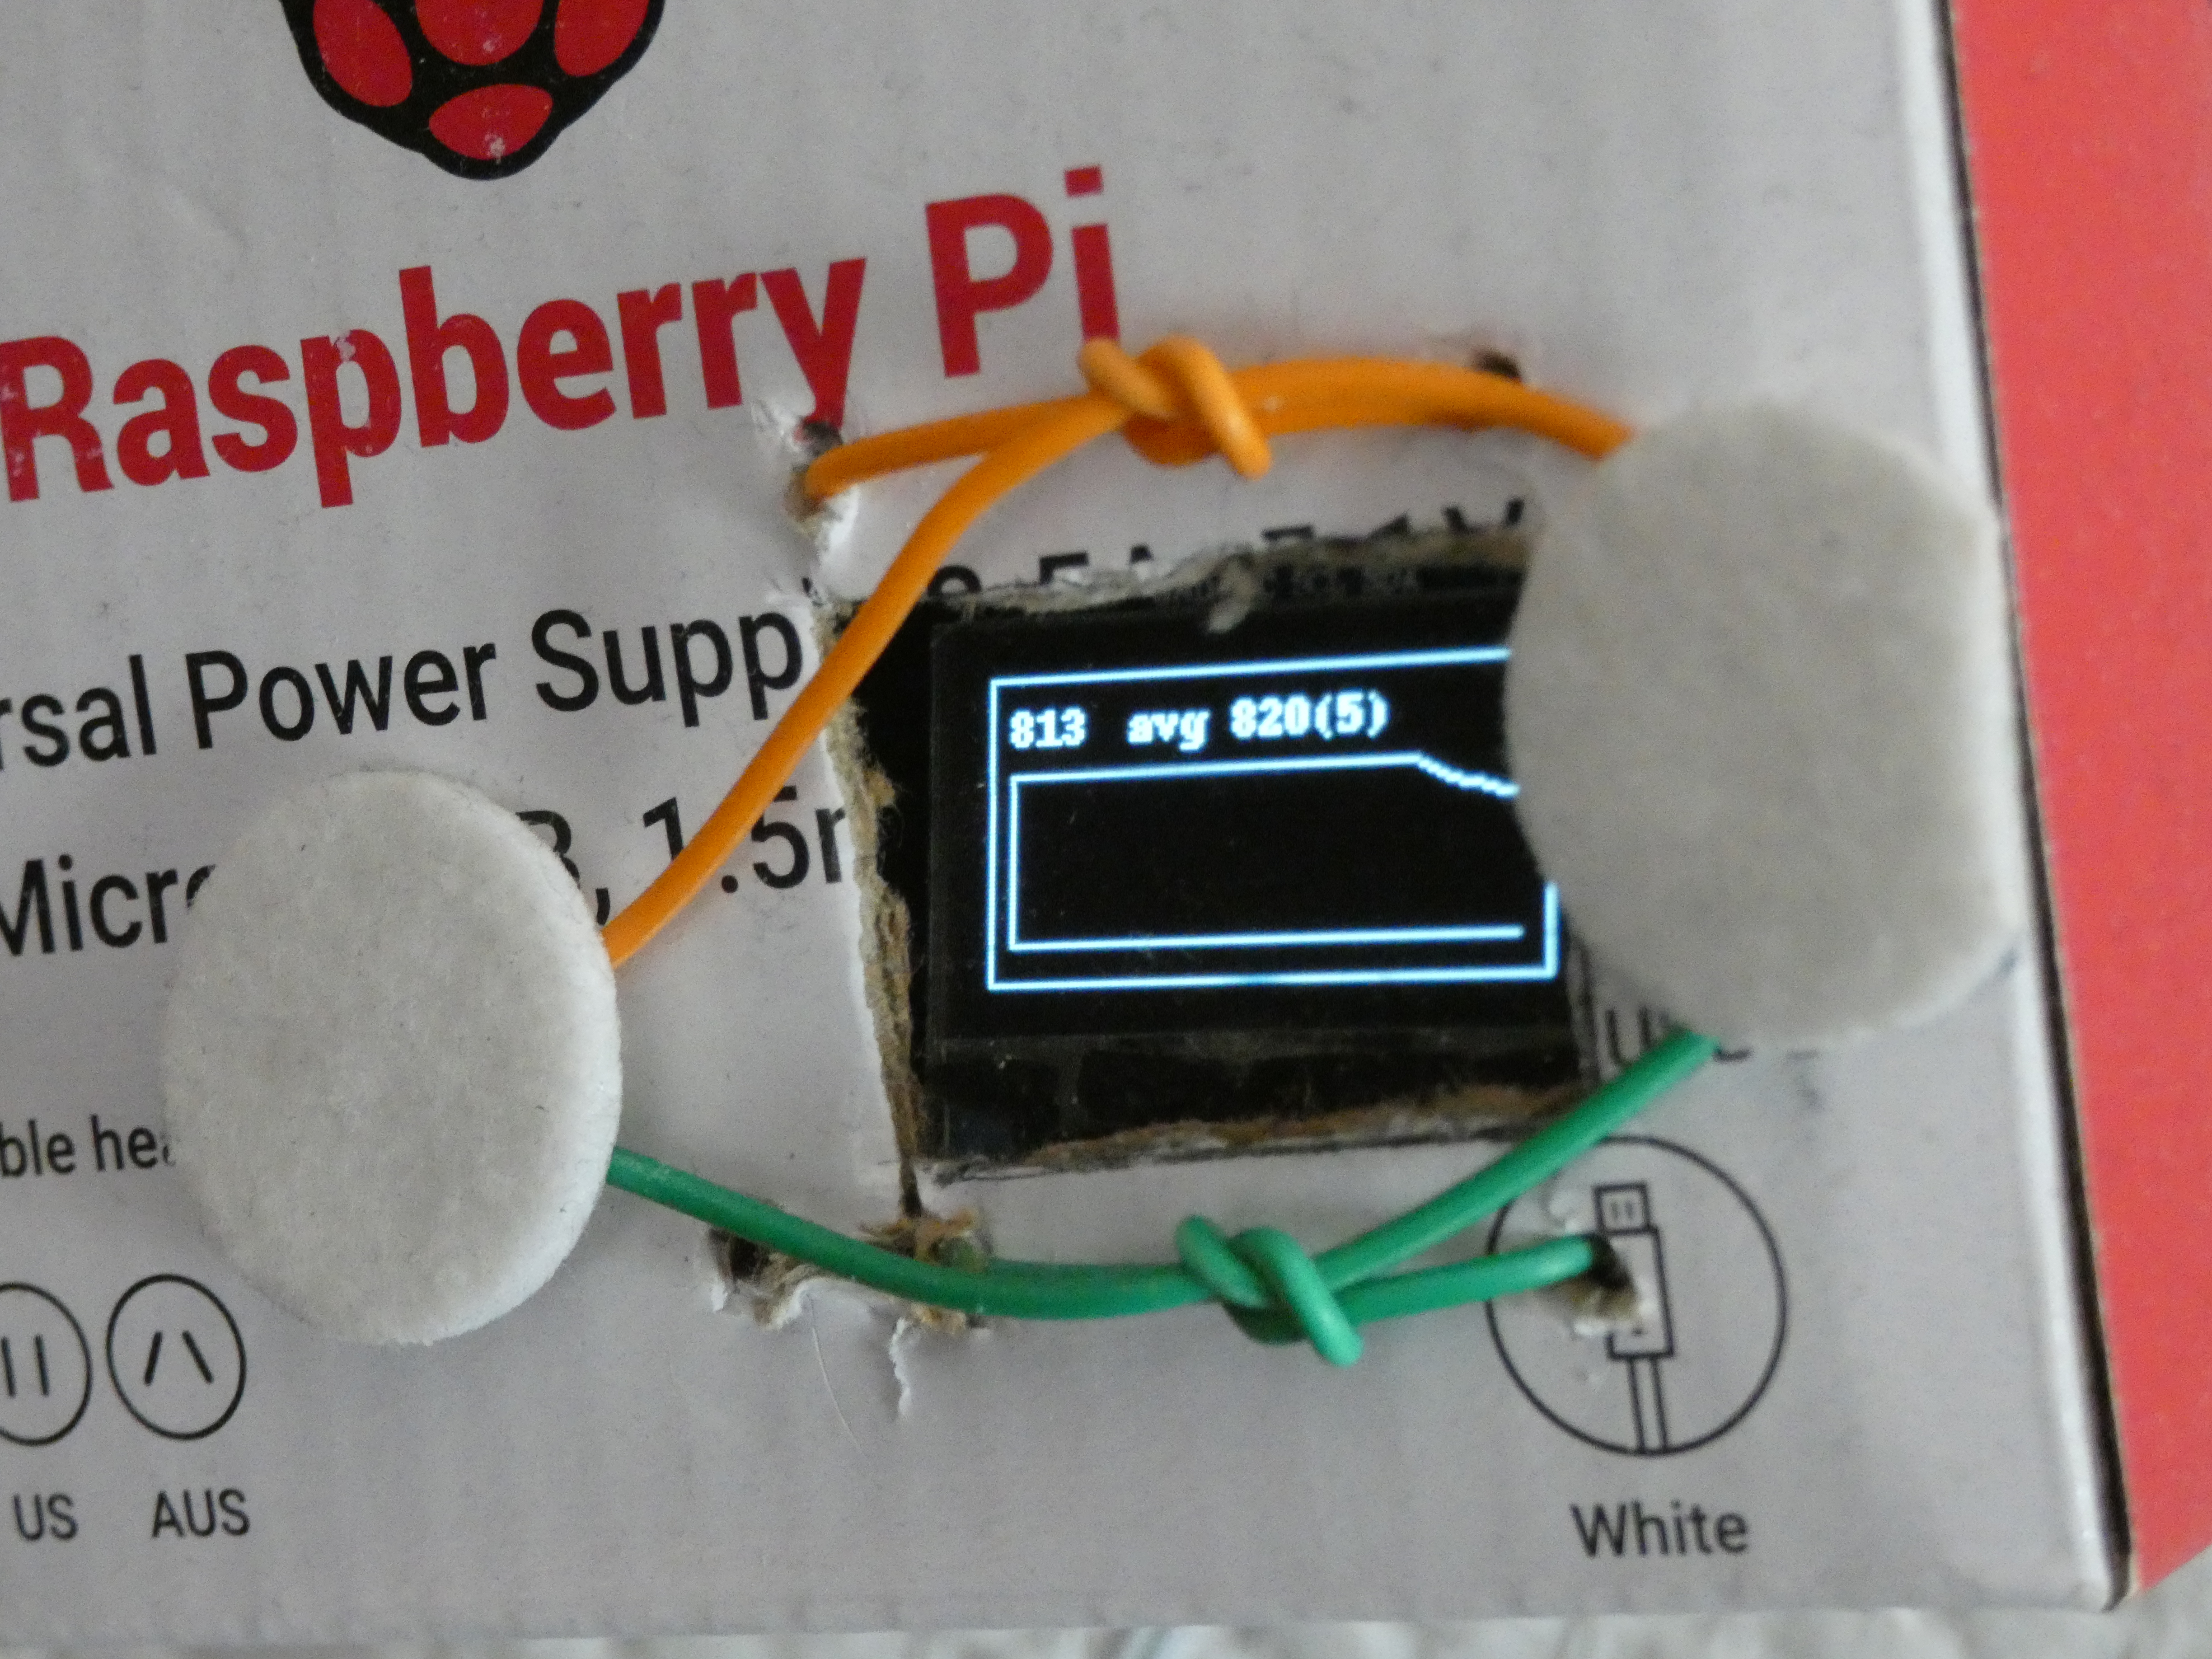
- Measure CO2 concentration every ten seconds and write the result in a textfile for later analysis as well as to the top left corner of the screen.
- Average the last six readings and display the mean on the top right of the screen (the bracketed value is the standard deviation). This is incredibly unnecessary. I correctly predicted that the sensor would sometimes measure incorrect values which may fool the user and this was my attempt to mitigate the scenario. Sometimes the module indeed just transmits its internal max value (5000ppm). That value is seldom plausible and furthermore could be just filtered out, well, by just ignoring any reading with value of “5000”. Furthermore, when there is rapid airflow, the readings tend to get a bit erratic. However, the general trend is still discernible to the observer, so the second part of the first line is quite useless after all.
- The bottom part of the screen is a graph showing time (or rather, the last hundred or so readings) on the horizontal and CO2 concentration on the vertical. The cutoff for readings is 1000ppm - I reasoned that everything above that should trigger me to open the window anyways, no further detail needed. Plotting is done manual and drawn pixel by pixel with the aforementioned luma library. I definitely recommend something like this because it adds a pint of gamification to ventilation and is fun to watch in general.
Lessons Learned
Right now, I have about a year of CO2 data lying around. Doing said analysis is on the to do list, so maybe give it another year? Anyways, for those reasons I won’t talk much about the actual finding regarding the management of carbon dioxide in my rooms but rather about the project. Let me just say, even the casual observations from the monitor are quite scary. Even medium sized room fill up with CO2 incredibly fast. With two persons and what I would call an average home office, we are talking twenty to forty minutes until reaching the level where concentration is impacted. Opening the window for too little time or opening it just a bit has a tendency to not get the CO2 concentration down at all. Sleeping in a closed room brings the levels up to a point where headaches and increased heart rate are to be expected.
So, open up a window, and let’s talk about some learnings through the lens of a side project.
Achieve Satisfying Function, Then Build Upon That
The main reason this project took so long is that I kept focusing on features that might matter in the feature and neglected the stuff that makes you go “Man, this is such a cool project!” for way too long. For example, I made the cabling way too complicated, because for the longest time I planned to attach a second sensor for data redundancy and error correction. Not only is this overengineering for the use case of “when should I open window”, it also prevented me to get the whole thing running for some time. Similarly, I spent way too much time thinking and testing on how and where and how often to save the measurements. Instead, perhaps I should have built a fun data visualization right away to be then motivated to fill it with data. And of course, my adventures in error mitigating statistics are to be mentioned. Informative? Sure, but the cost of getting frustrated and freezing a project because of such meaningless features is a high one.
Plan Your Hardware Setup
A Raspberry Pi itself is just the computer - keyboard, mouse and screen not included. So you need to attach those. And you probably want a second device to research error message or even to write your code. Especially if you happen to only have on keyboard (or mouse, or monitor), this might create a lot of frustration. Say you are somewhere in the middle of testing your brand new CO2 sensor. You want to test readings near of source of fresh air, like your office window. You realize that the power cable is not long enough, and you need to unplug it. You don’t want to risk data corruption, so you want to shut it down properly. But for that you need a mouse attached (or keyboard), which is currently attached to your other device. Sigh. After this whole process, you realize that you don’t have the newest version of your code on the Pi yet, and the LAN cable does not reach the new position on the window still. Now one of the cables came off. Which pin does it belong to, again?
I hope my point comes across - this of course not a technically hard problem, but if it ignored, it bites back. A little bit of discipline goes a long way: Connect your Pi to WiFi (if possible). Allow remote access to it via SSH. Maybe do spend five bucks on Craigslist for a second keyboard. Do scribble a sticky note with your pin connections. Write down what you are trying to do next before starting to unplug things. Note down errors and how you solved them - they will occur again.
But most of all, have fun hacking!